Summary and evaluate barcode diversity
Source:R/AllGenerics.R, R/method-summary_barcode.R
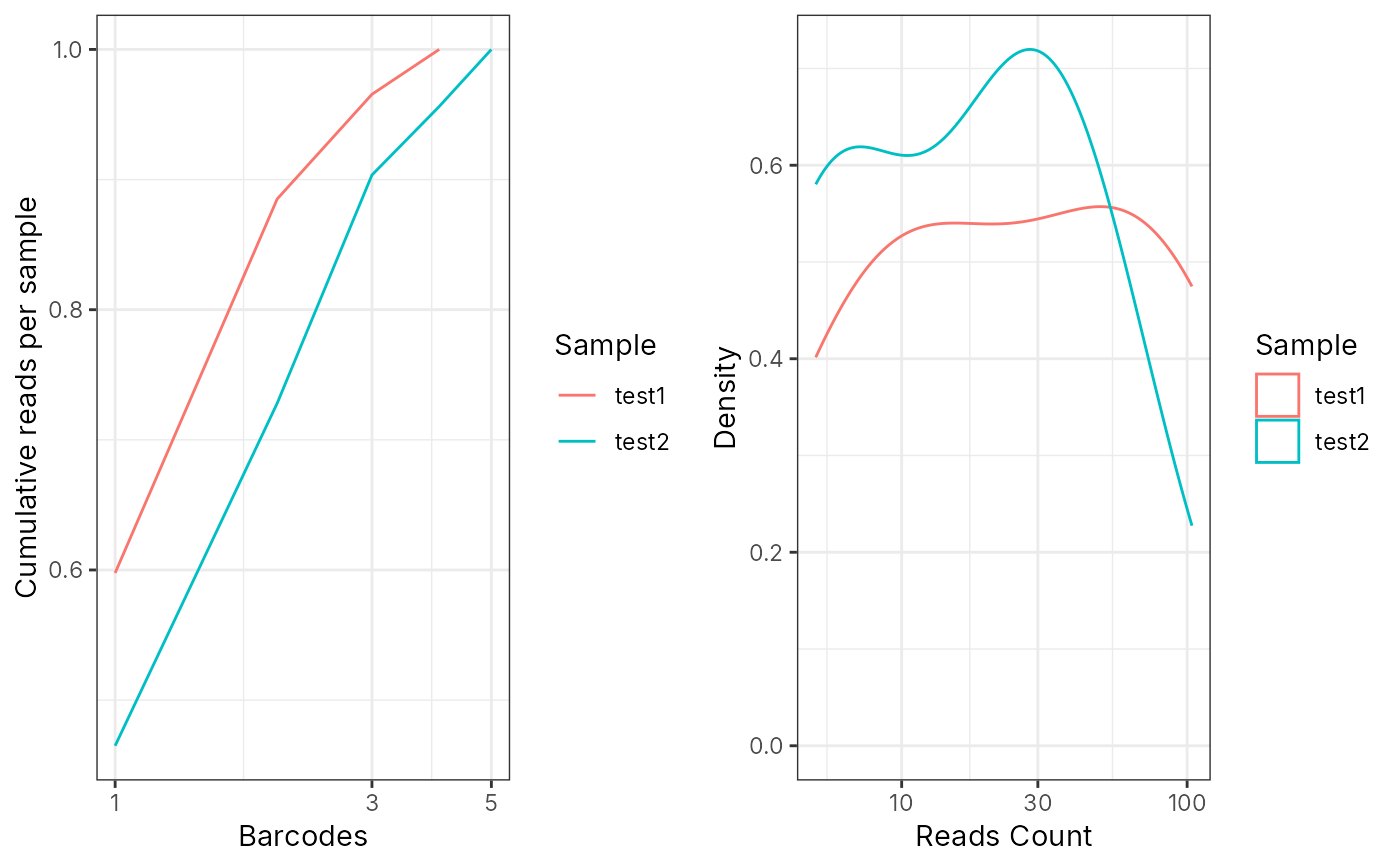
bc_summary_barcode.Rdbc_summary_barcode evaluates sequence diversity metrics using the
barcodes data in the cleanBc slot of BarcodeObj object. It
also generates Lorenz curve and barcode frequency distribution graphs.
bc_summary_barcode(barcodeObj, plot = TRUE, log_x = TRUE)

# S4 method for class 'BarcodeObj'
bc_summary_barcode(barcodeObj, plot = TRUE, log_x = TRUE)
Arguments
Value
A data.frame with the following columns:
total_reads: total read number.uniq_barcode: how many barcodes in the dataset.shannon_index: Shannon's diversity index or Shannon–Wiener index.equitability_index: Shannon's equitability.bit_index: Shannon bit information.
Details
Followings are the metrics used for evaluating the barcode diversity:
Richness: The unique barcodes number \(R\), it evaluates the richness of the barcodes.
Shannon index: Shannon diversity index is weighted geometric average of the proportion \(p\) of barcodes. $$ H' = - \sum_{i=1}^{R}p_ilnp_i $$
Equitability index: Shannon equitability \(E_H\) characterize the evenness of the barcodes, it is a value between 0 and 1, with 1 being complete evenness. $$ E_H = H' / H'_{max} = H / ln(R) $$
Bit: Shannon entropy \(H\), with a units of bit, $$ H = - \sum_{i=1}^{R}p_ilog_2p_i $$
Examples
data(bc_obj)

# filter barcode by the depth
bc_obj <- bc_cure_depth(bc_obj)
#> ------------
#> bc_cure_depth: isUpdate is TRUE, update the cleanBc.
#> ------------

# Output the summary of the barcodes
bc_summary_barcode(bc_obj)

#>   sample_name total_barcode_reads uniq_barcode shannon_index equitability_index
#> 1       test1                 174            4     0.9848302          0.7104048
#> 2       test2                 114            5     1.3048495          0.8107486
#>   bit_index
#> 1   1.42081
#> 2   1.88250
#> sample_name total_barcode_reads uniq_barcode shannon_index equitability_index
#> 1 test1 174 4 0.9848302 0.7104048
#> 2 test2 114 5 1.3048495 0.8107486
#> bit_index
#> 1 1.42081
#> 2 1.88250