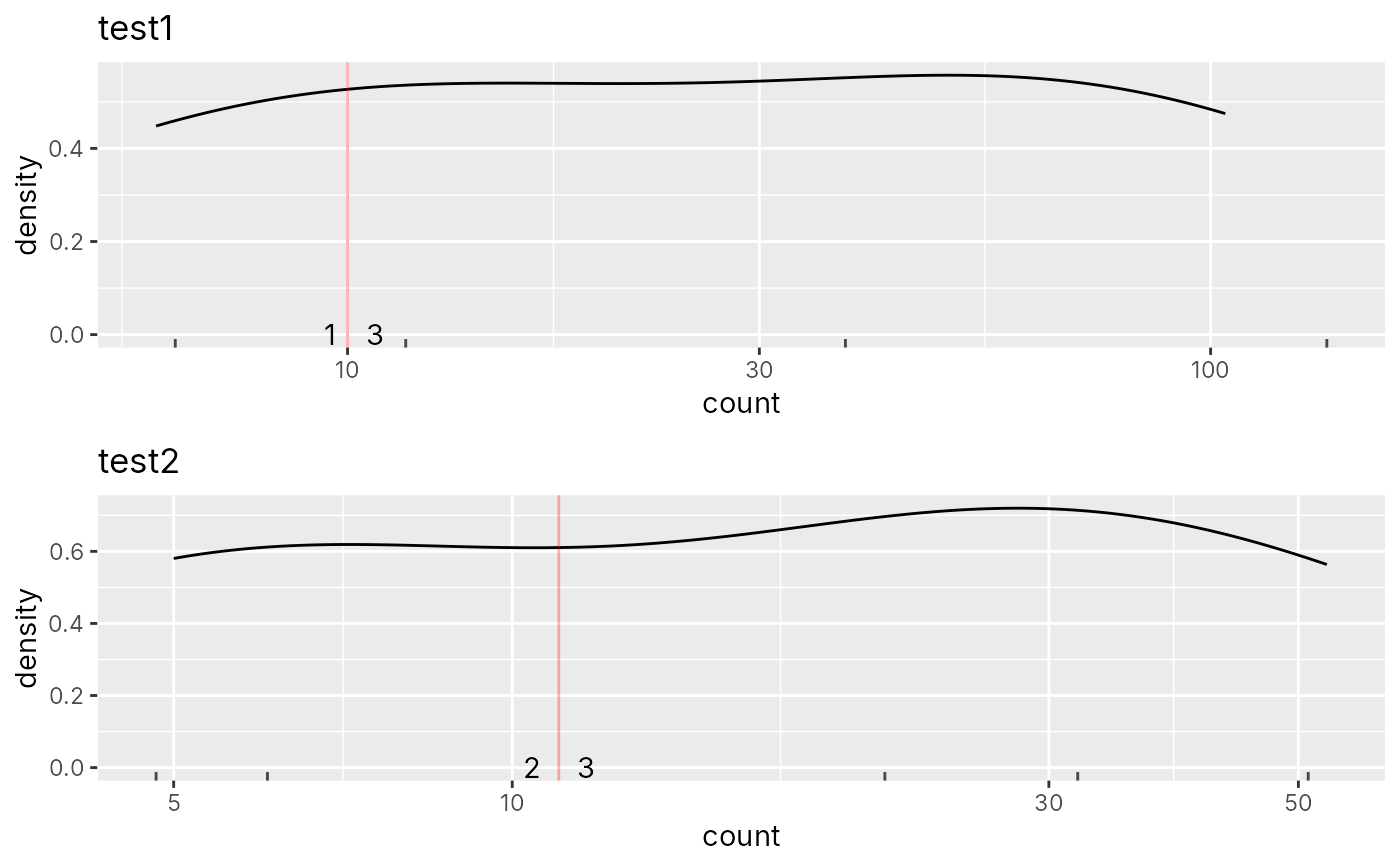
Scatter plot of barcode count distribution per sample
Source:R/AllGenerics.R, R/method-plot_barcode.R
bc_plot_single.RdDraws barcode count distribution for each sample in a BarcodeObj object.
bc_plot_single(
  barcodeObj,
  sample_names = NULL,
  count_marks = NULL,
  highlight = NULL,
  log_coord = TRUE,
  alpha = 0.7
)

# S4 method for class 'BarcodeObj'
bc_plot_single(
  barcodeObj,
  sample_names = bc_names(barcodeObj),
  count_marks = NULL,
  highlight = NULL,
  log_coord = TRUE,
  alpha = 0.7
)
Arguments
- barcodeObj
A
BarcodeObjobject has a cleanBc slot- sample_names
A character vector or integer vector, specifying the samples used for the plot.
- count_marks
A numeric or numeric vector, specifying the read count cutoff in the scatter plot for each sample.
- highlight
A character vector, specifying the barcodes that need to be highlighted.
- log_coord
A logical value, if TRUE (default), the
xandycoordinates of the scatter plot are transformed by log10.- alpha
A numeric between 0 and 1, specifies the transparency of the dots in the scatter plot.
Value
1D distribution graph matrix.