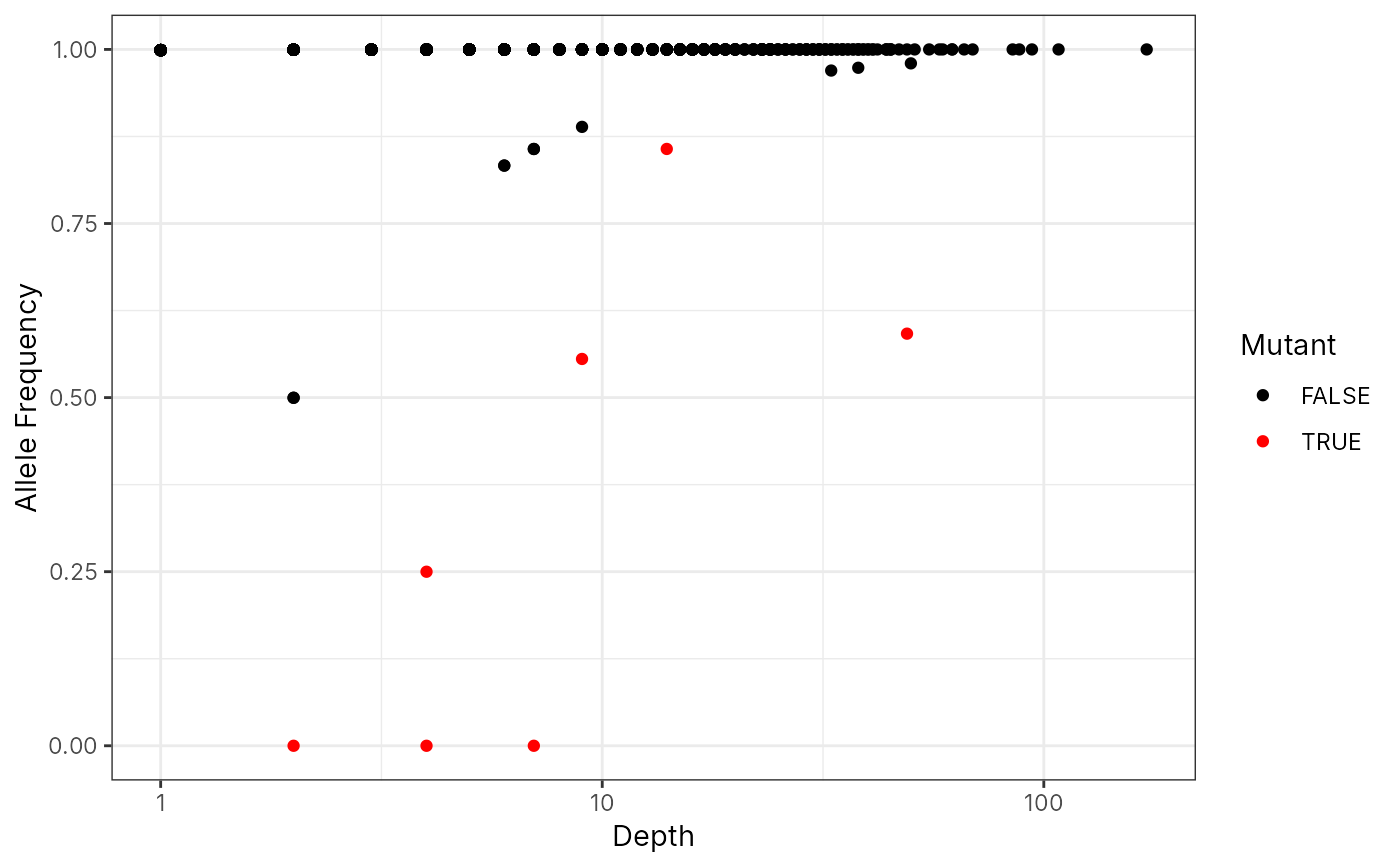
QC plot: 2D scatter plot for coverage ~ AF
plot_af_coverage(
  mtmutObj,
  loc,
  model = NULL,
  p_threshold = NULL,
  alt_count_threshold = NULL,
  p_adj_method = NULL
)
Arguments
- mtmutObj
an object of class "mtmutObj".
- loc
a string of genome location, e.g. "chrM.200".
- model
a string of model name, one of "bb", "bm", "bi", the default value is "bb".
- p_threshold
a numeric value of p-value threshold, the default is 0.05.
- alt_count_threshold
a numeric value of alternative allele count threshold, the default is NULL, which means use the value in mtmutObj.
- p_adj_method
a string of p-value adjustment method, the default is FDR.
Value
a ggplot object.
Examples
## Use the example data
f <- system.file("extdata", "mini_dataset.tsv.gz", package = "scMitoMut")

## Create a temporary h5 file
## In real case, we keep the h5 in project folder for future use
f_h5_tmp <- tempfile(fileext = ".h5")

## Load the data with parse_table function
f_h5 <- parse_table(f, sep = "\t", h5_file = f_h5_tmp)

# open the h5f file
x <- open_h5_file(f_h5)

# run the model fit
run_model_fit(x)
#> chrM.200
#> chrM.204
#> chrM.310
#> chrM.824
#> chrM.1000
#> chrM.1001
#> chrM.1227
#> chrM.2285
#> chrM.6081
#> chrM.9429
#> chrM.9728
#> chrM.9804
#> chrM.9840
#> chrM.12889
#> chrM.16093
#> chrM.16147
#>           used  (Mb) gc trigger  (Mb) max used  (Mb)
#> Ncells 2126169 113.6    3221262 172.1  3221262 172.1
#> Vcells 4298116  32.8   10146329  77.5 10123834  77.3
x
#> mtmutObj object
#> -------------------------------------------------
#> h5 file: /tmp/RtmppwH5Ub/file2395de0e13a6.h5
#> Available loci: 16
#> Selected loci: 16
#> Available cells: 1359
#> Selected cells: 1359
#> Loci passed the filter: 0
#> filter parameters:
#> 	min_cell: 1
#> 	model: bb
#> 	p_threshold: 0.05
#> 	alt_count_threshold: 0
#> 	p_adj_method: fdr

# Filter the loci based on the model fit results
x <- filter_loc(x, min_cell = 5, model = "bb", p_threshold = 0.05, p_adj_method = "fdr")

# plot the locus profile for chrM.200
plot_af_coverage(x, "chrM.204")
